
Like many business owners, I have invoicing software that allows me to keep track of my generated revenue. I also work with an accountant who helps me keep an eye on revenue, expenses, and net profit.
So, when I need to, I can get access to my numbers. However, when the numbers are scattered across different platforms, it’s not really possible to have a clear real-time picture. And it’s challenging to spot trends or do any analysis.
Therefore, just as with the rest of my meaningful metrics, we have a dashboard for SystemsRock financials.
The numbers that we track are:
1. Revenue
Naturally. This is the total value of signed contracts in any given period. The dashboard allows us to look at the yearly, quarterly, and monthly numbers. It also allows us to compare figures from different years, which helps us to spot trends and seasonal fluctuations.
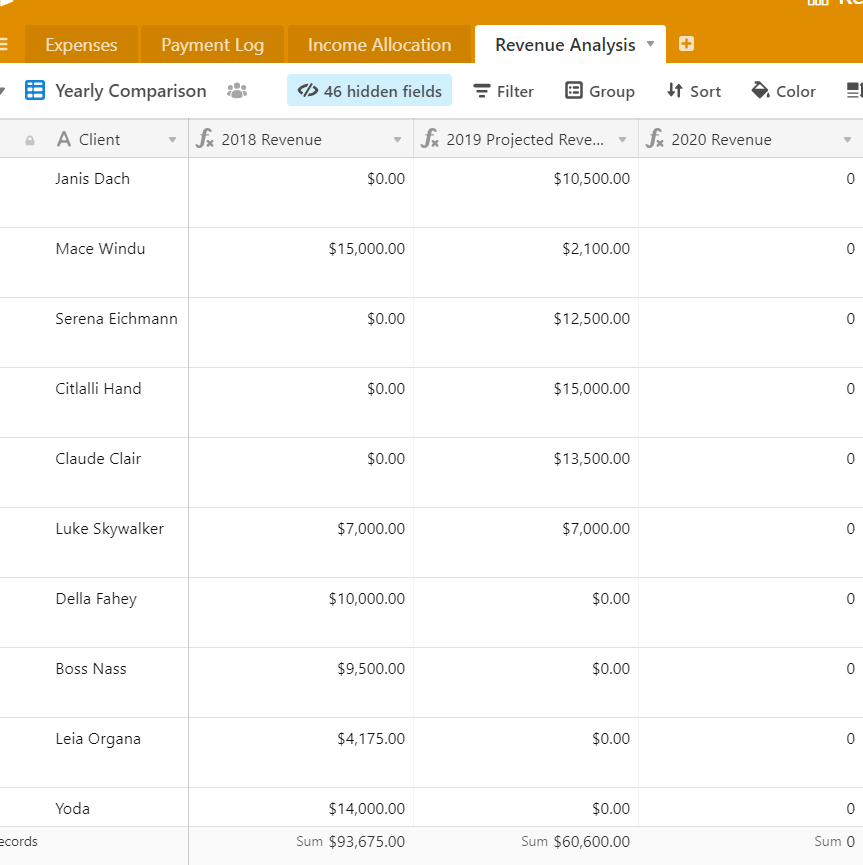
Until this year, we’ve been consistently experiencing a big bump in sales in January and September. Overall, our best quarters have been Q1, Q2, and Q4 with summer being relatively quiet.
Interestingly enough, this year has been different – we’ve been experiencing a steady climb since January. The numbers are telling me that it’s because we’ve been experimenting with new lead sources. It will be interesting to see if the trend continues.
2. Recurring Revenue
This is the revenue that we collect from retainer clients who are either on maintenance plans or receive monthly Meaningful Metrics Analysis Reports.
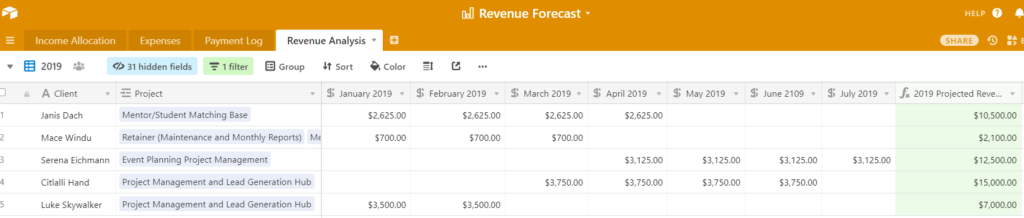
3. Projected Revenue
This is an estimate based on internal knowledge…knowledge we get from our sales & lead generation dashboard, that provides us with, the number and type of leads we’re seeing, projected value of contracts and where leads are in the sales cycle.
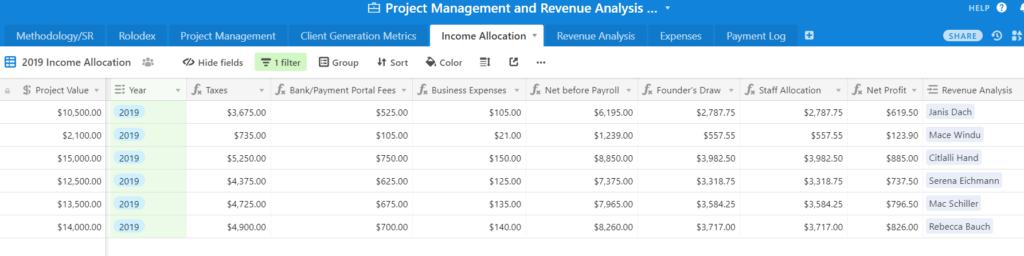
4. Profit First Allocations
Personally, I also have a mini-dashboard that splits each contract amount into profit, owner’s pay, taxes, and business expenses – the Profit First buckets. This dashboard is the basis of my cash flow management system.
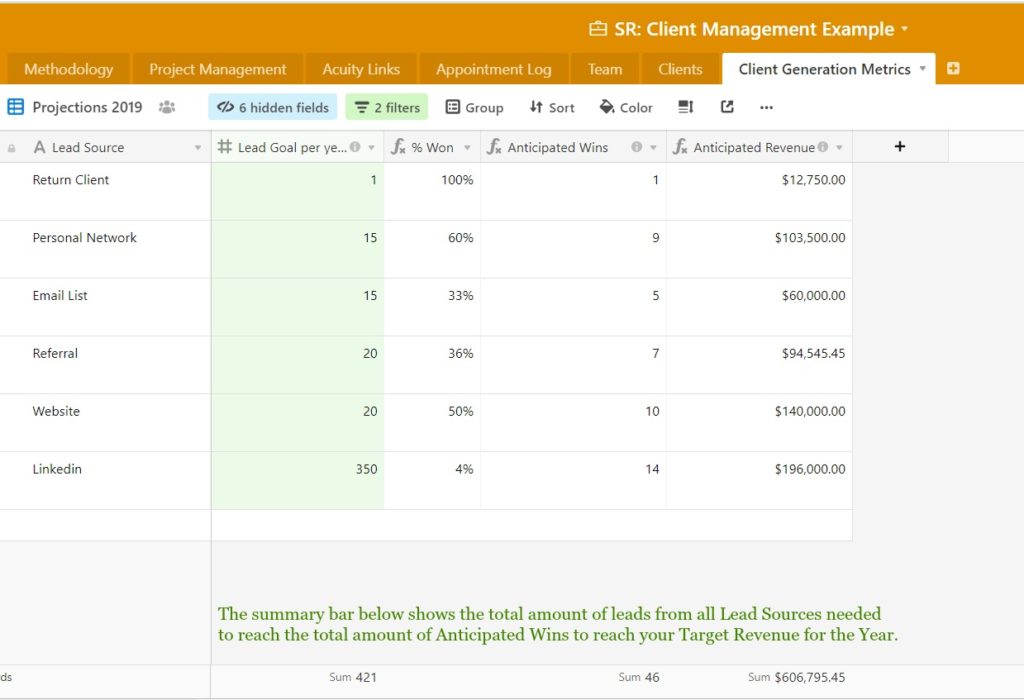
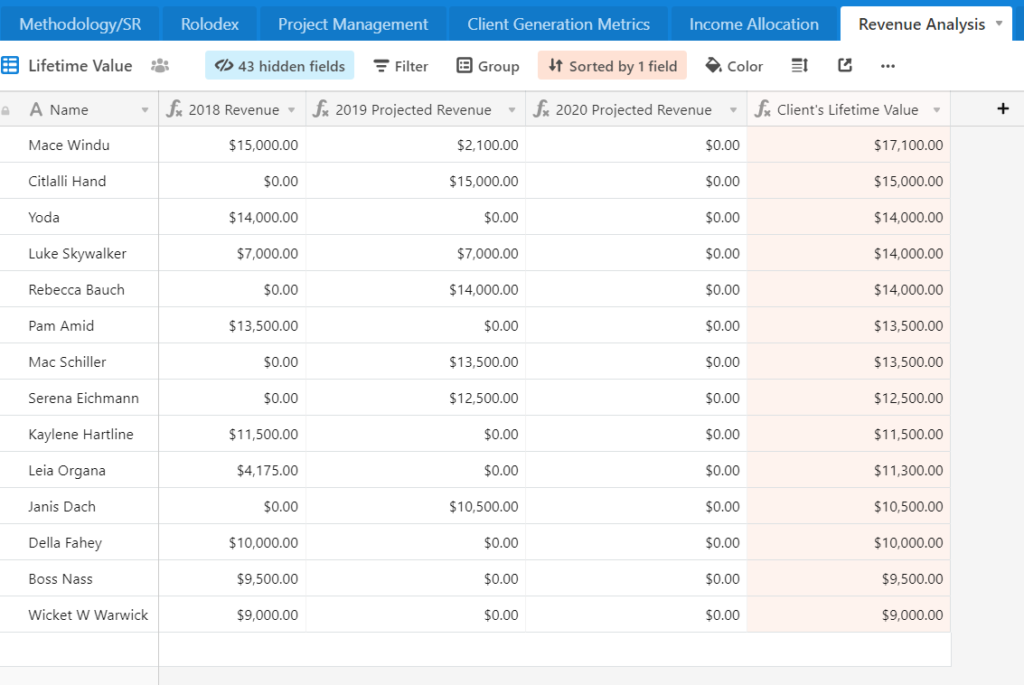
5. Lifetime Value of clients and the Cost of Customer Acquisition
Lastly, we calculate the Lifetime Value of our clients and the Cost of Customer Acquisition. This allows us to make smart decisions about different marketing tactics and lead generation channels.
To be honest, I started tracking these numbers for SystemsRock much later than for our clients – the cobbler’s children have a long wait for shoes, LOL. But it’s probably this transparency into our financials that allowed us to grow so steadily this year.
What about you? What gives you transparency into what’s working and not working?